 I have written before about 4% withdrawal rate. It is a considered to be a safe withdrawal rate for retirees. However, I admit that it is not perfect.
Historical data for ROI and inflation
I have made some charts to show how a 4% withdrawal would impact your net worth after retirement. I have used the S&P 500 annual rate of return from 1928 to 2017 and CPI USA historic inflation rate from 1956-2017 for my calculations.
There is no future data to show you what will happen in the future. So this is the best I could do with the past data.
Basic assumptions regarding retirement spending
I did not use 4% rule in the traditional sense that you withdraw 4% of your net worth every year no matter how much your annual expenses are. Instead, I adjusted 4% rule with 4% inflation rates based on the amount you calculated for first year’s withdrawal.
For example, if you retire with 1 million dollars, you would want to withdraw $40,000 for your annual expenses in the first year using 4% rule. Next year, the stock market could go up or down significantly, but your expense would still be $40,000 plus inflation (say $41,600 at 4% inflation rate). This way, you are guaranteed that your expenses will be covered even if the market goes down significantly (say 30%). If you would just use 4% rule to withdraw that year, you can only withdraw $28,000 which may not be enough to cover your expenses.
In the reverse scenario, when the market will go up significantly, you would still withdraw $40K adjusted for inflation and keep the surplus invested.
Net worth without inflation adjustment
The following chart shows the present net worth in multiples of your net worth on the year you retired. For example, if you retired in 1928 with a net worth of 1 million dollars, your net worth in 2017 would be around 130 million.
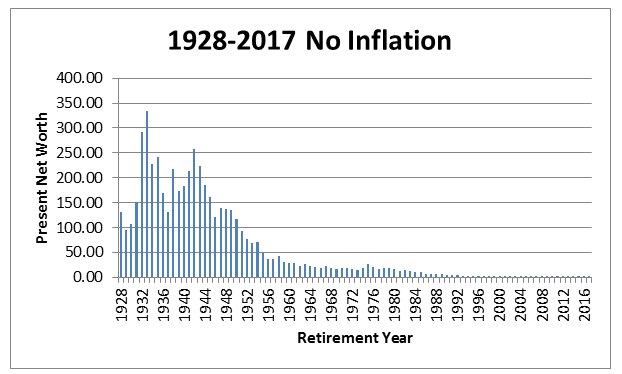
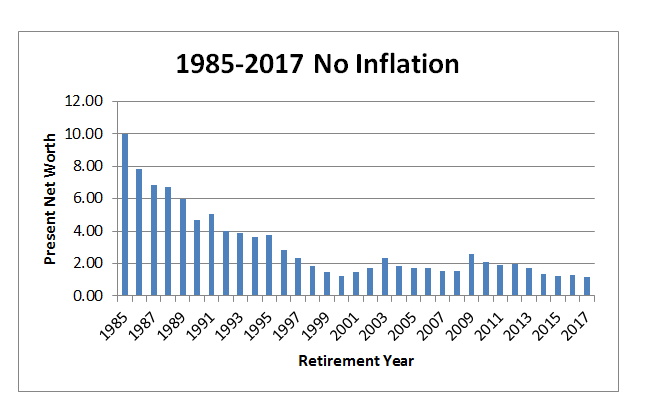
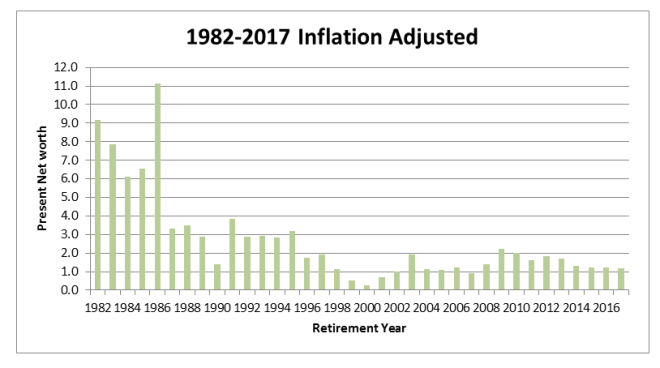
It is difficult to see the data in above chart for years 1985 and forward due to the scale of the chart. So I have adjusted the chart to zoom into the 1985-2017 data which you can see below.
From these two charts, you can see that your net worth at present would be at least a million dollar, no matter what year you retire.
It looks great, but wait…
It looks very good, except that the net worth is not adjusted for inflation on the above charts. Only the withdrawals are adjusted for inflation. Since the 1 million dollar at present is significantly less than 1 million dollar in the past, the above charts do not tell you the full story.
For example, if you had retired in the year 2000 (worst year to retire in recent history) with a million dollar invested in an index fund, even after taking out inflation-adjusted $40,000 every year for your expenses, you would still have over one million in your investment account in the year 2017. But since one million in the year 2000 is more than one million in the year 2017 due to inflation, this is not like for like comparison.
Just so you know, at 4% inflation rate $40,000 would amount to $78000 in 2017.
Let’s see how inflation will change the picture
Because of the inherent flaw in the above charts, I went ahead and adjusted the net worth based on the historical inflation rates in the US. I also adjusted the withdrawal amount based on the inflation rate.
For example in the above example of the year 2000 retiree, the inflation rate is less than 4% for every year except in the year 2007. Using the actual inflation rates, the year 2017 withdrawal amount for the above retiree would amount to $57,000.
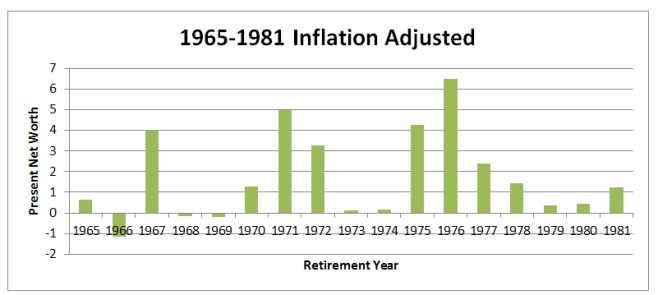
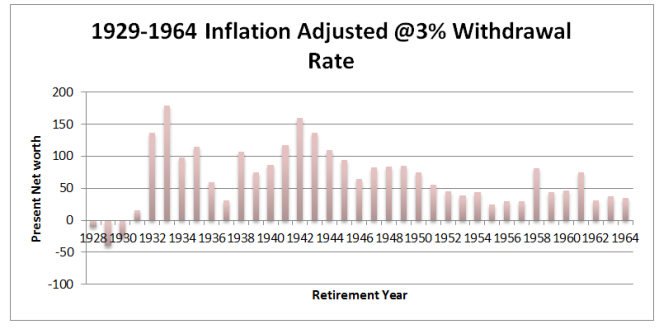
Here are the inflation adjusted charts for both net worth and withdrawal. Instead of a single chart, I created three charts to adjust the scale, but it is the same data.
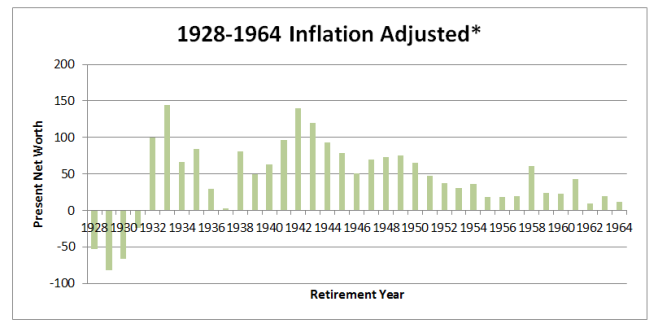
* Since I could not find the inflation data for years before 1956, I used 4% for my estimates.
Hmm, Inflation does change the picture
As you can see, the results are very different when you adjust for inflation. There are years where you would go into negative, which means you would run out of money in retirement. Even if you ignore the beginning of the chart (1928-1931) as these could be anomalies and since 4% inflation rate is probably not accurate, there are still more recent years (1966, 1968 and 1969) where you would go into negative in 2017.
If you were to retire in the year 1966, your money would only last until the year 2004. Similarly, you would only last until the year 2012 if retired in the year 1968 and 2008 if retired in 1969. This may not be a big deal if you were a regular 60+ retiree, but if you are an early retiree, you may run out of money while you are still alive.
What if I stick with 3% withdrawal rate instead
Just out of curiosity, I went and did the same calculations for 3% withdrawal rate. Does a 3% withdrawal rate guarantee that you will not run out of money in retirement?
3% withdrawal rate is not perfect either
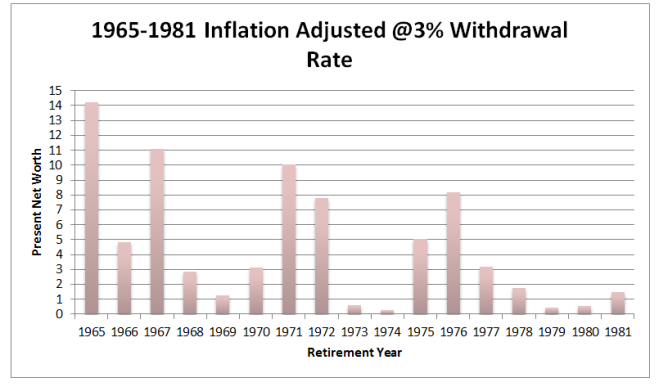
The results were better with 3% withdrawal rate. In none of the retirement years besides the first 3 years (1928-1931), you would go into negative. If you were to retire in the year 1966, you would still make it until the year 2017 with some (although not much) positive net worth. However, it looks worrisome for the year 1973, 1974, 1979, and 1980 retirees and your saving may not last for too long in the future. Again this would only be a problem for an early retiree, not a regular retiree.
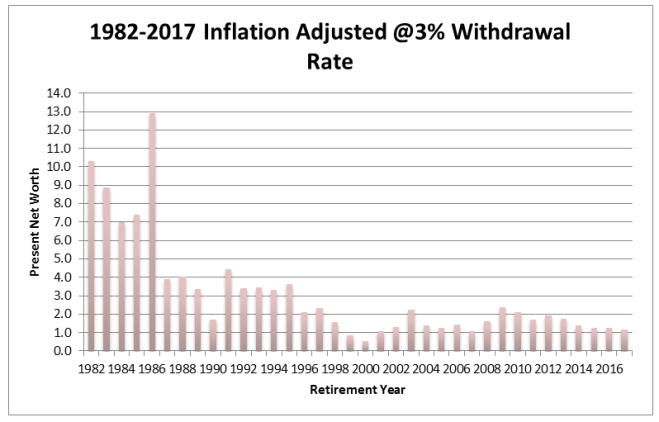
More worrisome would be for years 1999 and 2000 retirees. For example, if you had retired in the year 2000 with 1 million dollars, you would be down to $550,000 by the year 2017 at 3% withdrawal rate. This would be even worse at 4% withdrawal rate, only $270,000 would be remaining at 3% withdrawal rate. These amounts are worrisome for regular retirees let alone early retirees. Years 1999 and 2001 are also not good, as you would have less than a million dollar in 2017 if you are retired in either of those years at 4% withdrawal rate.
Should I be worried?
As you can see, how well you will do in retirement depends on how good the investment returns are in immediate years after your retirement. Based on the historical data, some years are not good for early retirees. But these years are also known to be the worst years in financial history.
For example, 1999-2001 was when the dot.com bubble crashed.
1973-1974 was the years of infamous market crash compounded with double-digit inflation.
1979 and 1980 had double digits inflation.
Conclusion
In conclusion, 4% withdrawal rate or even a 3% withdrawal rate does not guarantee you to retire early without having to worry about money.
But if you plan well, you do not have to worry too much. For example, the result was only bad if you had chosen to retire at the peak of the bullish market or in the beginning bearish market. If you could avoid choosing those years, you need not worry much.
How well you would do in retirement depends upon what happens to the stock market in immediate years after your retirement.
But no one can correctly time the market and I do not recommend doing so for your retirement.
But you should not count all your money for retirement if the market has continued to be bullish for some years before your retirement. In such situations, although you can not time the market successfully, you can put a cushion to your retirement savings, so as to nullify any immediate market crash.
But best security for an early retiree is that you are still young and able to work. So be prepared to work for a few more years than your retirement date if things do not look as promising.
